
Your test automation engineers might put a lot of effort into setting up test automation project infrastructure. But they won't succeed unless they use effective and accurate test automation reporting metrics and test visualization.
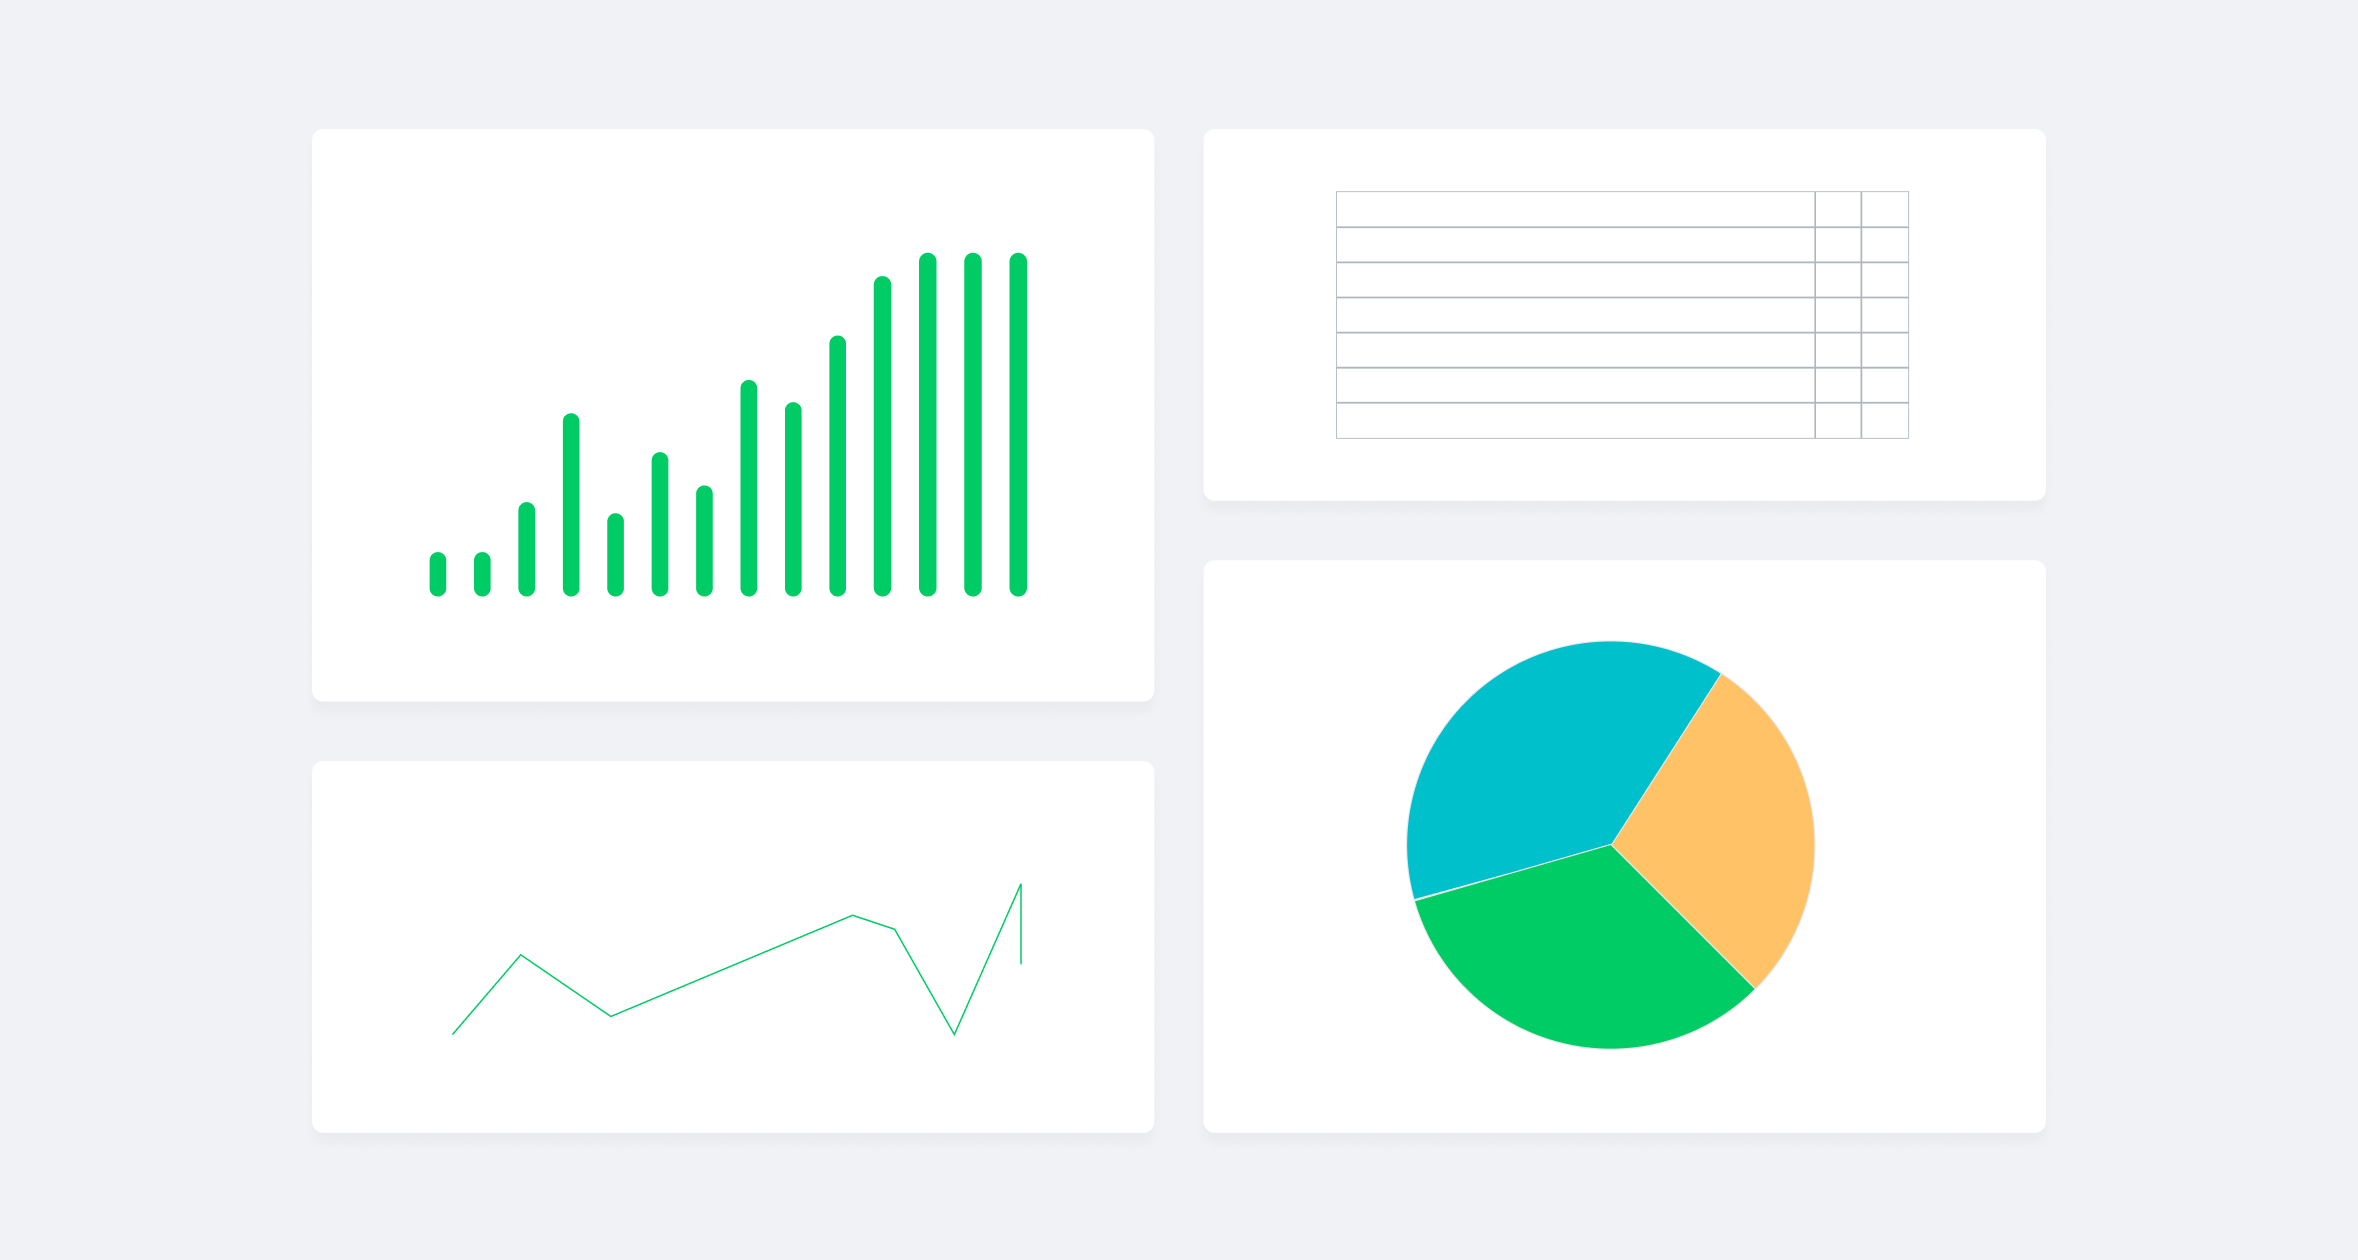
Visualization in software development is like a vision for a human. You can live without it, but life makes a lot more sense when you can see the world. The same applies to test visualization. It brings a new understanding of automated test results.
Why you need to visualize Automated Test Results
Test visualization allows sharing the information across your team easily and quickly, helps track the project’s status and progress, and allows making swift improvements whenever needed. It helps sync up your testing teams, shows the most important results of the test suits and facilitates strategic decision-making.
There is a science behind data visualization: it is estimated that it takes up to 150 milliseconds to process text and only 13 milliseconds to process images.
Let’s take an example: what would you prefer to evaluate relatively quickly the progress of the project, fifty pages of text or fifty images? The answer would most likely be 50 images since visualized testing metric reports allow staying abreast of the testing quality of the project continually.
Test Automation reporting metrics
To evaluate the automated test results correctly and to do the test visualization well, it is necessary to use the proper metrics. Even though results depend on the test automation tool you use, some basic metrics should be available as a cornerstone for analysis.
- Number of Scripts. This metric shows how many scripts a particular suite includes, demonstrating the progress in the work on the project and partly the coverage of the work that has been done.
- Testing Duration. It helps you understand how long a test execution takes and when the testing will be ready for the next time. However, this metric doesn’t tell you anything about the quality of the tests you are running.
- Test Case List. On this list, you can see all the test cases that have been completed during a certain period of time. It allows for generating a tabular report that will make it easy to examine the progress and performance of the project.
- Test Result. When you need a general picture of the testing progress, using this metric may come in handy to show the amount of passed and failed tests in relation to the total number of tests. The visual representation can help compare the figures across different days and releases. Unfortunately, Test Result Metric does not provide insights about the quality of test coverage and about the meeting of the business requirements.
- Environment. It demonstrates the information regarding different environments on the project development environment, quality assurance environment, staging and integration environment, performance testing environment, etc. The large projects might incorporate more than 30-40 different environments, and the organization of this information is significant and effective.
- Number of Defects. This metric shows how bad a software release is compared to previous releases. It is beneficial for predictive modeling since it helps to estimate the number of defects under certain conditions. Still, this metric is optional since it identifies issues without uncovering their depth and severity.
Take the above-mentioned automation reporting metrics as a starting point, and arrange the information into a couple of graphs on a test automation results dashboard – if the tool you’ve chosen fails to enable that. You may visualize and analyze test automation data easily.

How to improve Automated Test Reporting
Professionals in the domain of test automation often struggle to manage large amounts of information from automated test reports and use them effectively.


I remember my days working in large teams. We had a sad tradition: we would have to review test results and spend hours debugging them, trying to make sense out of those reports.
Nikita Sidorevich in his interview for Test Guild by Joe Colantonio added that delegating testing to algorithms trained by machine learning is a perfect use of technology to facilitate and improve routine analysis. Using test automation reporting metrics and test visualization is a must to scale your automation testingefforts.
Follow these recommendations to improve test visualization and test automation reporting metrics:
- Plan quality assurance processes and testing
- Use software development management oriented on test automation
- Make testing often and as early as possible
- Realize formal technical reviews
- Ensure a relevant work environment for the QA team
- Optimize the usage of automated tests with CI/CD processes
- Use code quality measurement
- Report bugs efficiently
With that in mind, you can make test visualizations and test automation reporting metrics that can help you to shape and ensure the best quality for your project.
Test Result visualization tools
There are many tools that help to visualize automated test results. Among the leading ones, it’s necessary to mention Testrail, Zephyr and Zebrunner. Each of them has its own functionality, features and specifics that fit into the different contexts, needs, and requirements of the client.

Testrail is a test reporting and visualization tool that allows for creating test plans, managing test repositories, tracking the execution of tests, monitoring coverage of automation tests and generating meaningful reports. It can be integrated with different ticket management systems (for example, Jira).
Zephyr is a test automation tool that provides the possibility to test at scale and to implement or use CI/CD pipelines. Zephyr is native to Jira. If you use that ticketing system, the integration is already taken care of for you. If not, you should look for other options for automation testing tools for visual reporting.
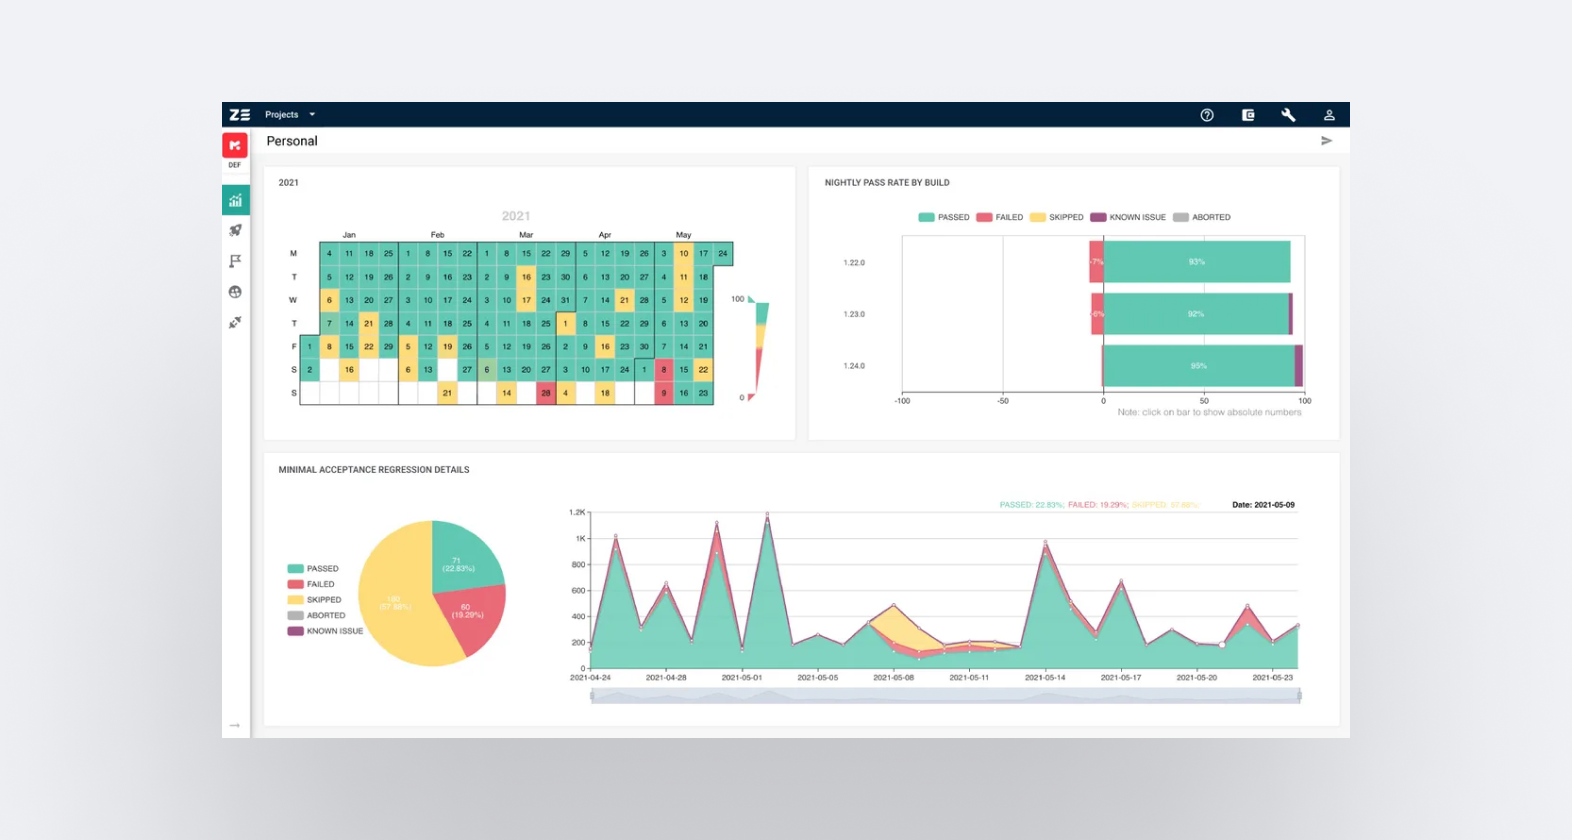
Zebrunner is a solution based on the tester’s mindset. It allows the users to track the situation with test sessions in real time. Test automation teams may also access a test log tracking option, screenshotting, and video recording. Such features simplify the analysis process for engineers and managers when dealing with failed test cases.
Some Test Result visualization tools to use
The choice of a proper visualization tool for automated test results is crucial for the testers’ performance and the project’s overall success. You are free to use the product that fits your needs and requirements the most. But some solutions are more informative and efficient than others.
The QA Lead community recognizes Zebrunner as one of the best QA automation tools for software testing. Such high evaluation can be explained by the fact that the tool allows easy native integrations with some of the most used ticketing systems, CI/CD, bug management and testing platforms. It also neatly visualizes what happens with the product at different scales and at different stages of software development.
The professional team you need
Visualization of automated test results is not an easy task since it requires a lot of time, knowledge, experience and effort. Every item you choose for a test automation report will provide a biased and incomplete view of the overall test status. Therefore, you may need a professional testing team as well as project managers for assistance.
Professionals will decide if there’s an out-of-the-box solution that will meet your individual business needs. Otherwise, they will offer to tailor features from scratch or find a combination of commercial software that supports some customization. As there’s no one-size-fits-all solution, the best way is to search the market to see what is out there and come up with the best solution.
If you’re looking for simplicity and ease of use, Zebrunner can help you at any stage of your project. An average test automation specialist can implement this tool to get this full-scale reporting system for your business. Thanks to Zebrunner, which includes both test execution and reporting, one can speed up the time to market.
Make sure not to underestimate the value and necessity of test visualization and test automation reporting metrics. They will definitely positively impact your project’s efficiency from both short and long-term perspectives.